How to Calculate a Test Grade (and Where Graders Disagree)
Turn questions wrong into a percentage and a letter grade, and see where rounding, curves, and the 7-point scale quietly change the answer.
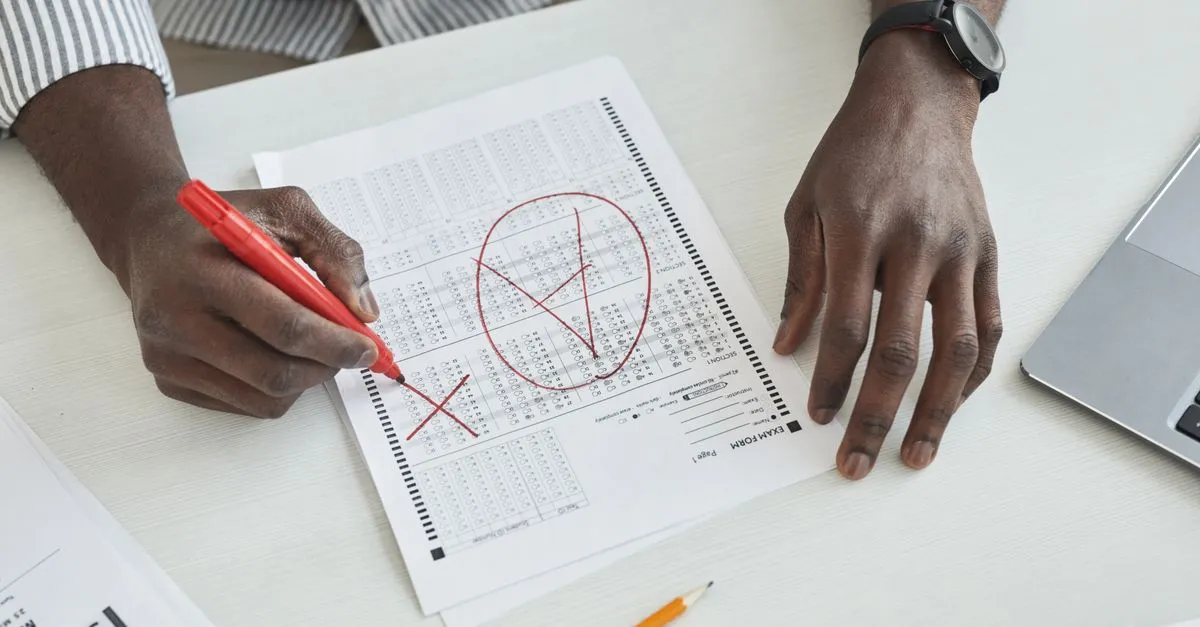
The cardboard grading wheel — the EZ Grader, if you had one in a desk drawer — solved a problem that was never really about arithmetic. Three wrong out of twenty is 85%. Anyone can do that division. What the wheel saved you was doing it sixty more times, once per paper, while half-listening to a class that was supposed to be reading quietly.
The Grade Calculator replaces the wheel with something that also shows its work. Type the number of questions and the number missed, and you get the percentage, the letter, and a chart with a row for every possible number of wrong answers. Grade the first paper, then use the chart for the rest of the stack.
The division, and the part after it
Correct answers divided by total questions, times one hundred. On a 20-question quiz with 3 wrong: 17 ÷ 20 = 0.85, so 85%.
Points work identically. A 50-point exam that lost 7 points scores 43 ÷ 50 = 86%. The calculator does not care whether you feed it questions or points, which matters more than it sounds like it should — plenty of graders keep two tools open for no reason.
The second step is the one that causes arguments: turning 85% into a letter. That conversion is a school policy, not a mathematical fact.
Rounding settles more grades than anyone admits
A student finishes with 89.5%. Is that an A?
If the gradebook rounds to whole numbers, yes. If it does not, it is a B, and the difference between those two outcomes has ended up in front of more than one department head. Most online graders round silently and never tell you which direction they went.
So the calculator has a rounding control: whole percent, one decimal, or two. The letter is chosen from the rounded figure, which is how an actual gradebook behaves. Set it to match your syllabus once and the question stops coming up.
The 7-point scale is not a rumor
The 10-point scale is the one everyone pictures: A is 90–100, B is 80–89, down to F below 60.
The 7-point scale is stricter and very much alive. An A starts at 93, a B at 85, and the pass line moves from 60 up to 70. Nursing and pharmacy programs use it widely, and so do some AP and honors sequences. Under that scale a 92% is a B, and a 65% — comfortably passing almost anywhere else — fails.
Plus/minus grading splits the difference with thirteen bands instead of five. The calculator offers all three, plus pass/fail, and the chart redraws the moment you switch.
Curves, and the order they go in
A flat curve adds percentage points to every score before the letter is picked. A raw 85% with a +5 curve becomes 90% and moves from a B to an A. Scores cap at 100, so a 98% does not come out as 103%, and the uncurved percentage stays visible underneath so nothing about the adjustment is hidden.
Order matters here. Some gradebooks apply a curve to the course average instead of the individual test, and that produces a different letter on the paper in front of you. Neither approach is wrong; they just are not the same, and it is worth knowing which one your school does before you hand anything back.
The question students actually ask
“How many can I miss and still get an A?”
The answer changes with the length of the test, which is why the calculator lists it per grade: on a 20-question quiz graded on a 10-point scale you can miss 2. On a 40-question test, 4. On a 12-question quiz, 1 — which is the sort of thing worth mentioning before the quiz rather than after.
Open the Grade Calculator, enter the length of your test, and print the chart. It also works from a phone at the kitchen table, which is where most of this grading really happens.